[ Read on Medium ]
There is an ever-widening recognition that started some time ago that we are living through an age of transition from a unipolar world that existed after the collapse of the Soviet Union, to a new multi-polar one. This has been spoken about outside polite company for at least the past decade (I remember William Buckler, the Privateer, was already saying as much as far back as 1998-1999 when I became a subscriber, if not earlier). It was never a matter of “if” as much as “when” and what the ultimate catalyst will be.
We’ll probably all concede we’re there the day that the US dollar loses it’s status as the global reserve currency, but who knows what specifically will lead up to that or what the timeline will be. One of my absolute favourite quotes is Douglas Casey’s “Just because something is inevitable, doesn’t make it imminent”.
For now, while Venezuela implodes and Turkey looks headed for a wipe-out and capital controls, the USD is still a destination for capital flight.
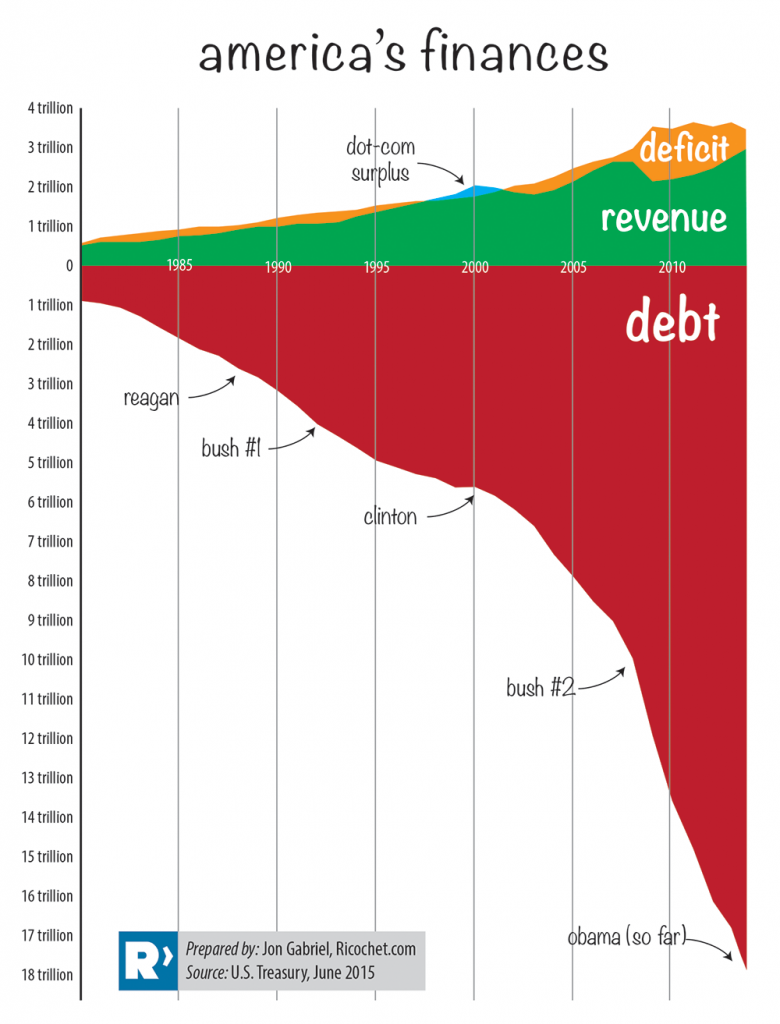
This morning I came across a chart on Twitter that put things in perspective for me, I didn’t save it so it took some searching when I sat down to write this but I found it here:

It’s from Jon Gabriel’s 2015 article “Athens on the Potomac” where he took time out from the then brewing Greek debt crisis to point out the US’s own balance sheet looked hauntingly familiar, if not an order of magnitude larger. If pundits were wondering how on earth the Greeks thought that their levels of debt were sustainable, what must they think when they look at this?
Of course, people like Krugman think this doesn’t matter. The US has the world’s reserve currency and the Greeks, not so much. That makes the chart above, apparently, sustainable, since no sane US politician would make any serious move to reverse it.
Another reason I like this chart so much is because it puts those hallowed “Clinton Era surpluses” (which were more slate-of-hand than actual surpluses) in perspective. With the Trump tax cuts and trillion dollar deficits, this chart will simply continue on trend.
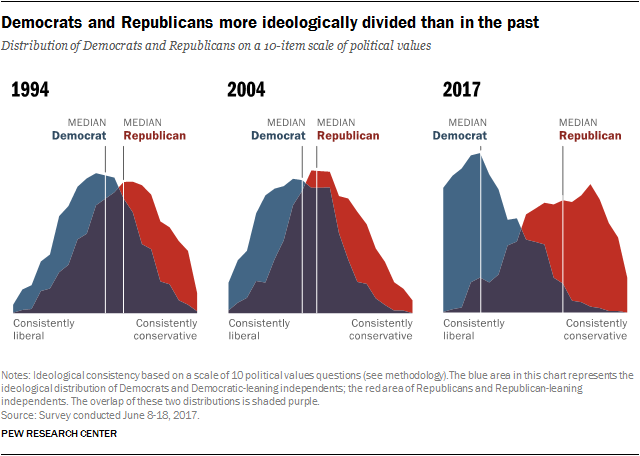
The other data set I came across was when “Fed Up” author Daniella Dimartino tweeted W Ben Hunt’s “When Things Fall Apart, Part 1“, a good read not about the debt bomb but about the polarization of the voting populace in the USA. The theme of his post “The Center Cannot Hold” finally captured something that I’ve been trying to articulate in private, and failing. It’s the fact that the “left” vs “right” dichotomy has likely passed a point-of-no-return in the USA.

If you read Hunt’s article carefully, you will get that he is saying there will be no return to normalcy. From here on out the US will be whipsawed between the right and the left with ever-increasing intensity and escalating polarization:
what’s the problem with a bimodal distribution? The easiest way to think about it is to compare the size of the purple area (where both the Republican and the Democrat electorate overlap) with the pure blue area (Democrat with zero Republican overlap) and the pure red area (Republican with zero Democrat overlap). When the purple area is smaller than both the blue area AND the red area, a centrist politician (someone between the median Democrat and the median Republican) can win neither a national nomination nor a national election in a two-party system. For any centrist candidate or policy, there exists a winning majority of voters on both the left AND the right who will favor a competing candidate or policy on both the left AND the right. This is what it means to say that the center cannot hold.
This chart is why incumbent Republicans who speak up against Trump or Trump policies lose their primaries to 9-11 Truthers and that incel-in-training kid in 10th grade history class who proclaimed that the Civil War wasn’t really about slavery. This chart is why incumbent Democrats who aren’t outright Socialists lose their primaries to latte-sipping, fashion-forward young things who honest-to-god believe that Fidel Castro and Yasser Arafat had some pretty good ideas if you just stop and think about it.
This chart is why mainstream and relatively centrist political candidates lost
Hunt compares this bimodal distribution with what happened in the decline and fall of the Roman Empire, only that took 400 years to play out. People like Jon Micheal Greer, in The Long Descent, make the case that the US Empire will end in a similar, drawn out, wind-down fashion similar to Rome, as opposed to a collapse into Mad Max style fighting over tins of dog food.
The two data sets considered together to me hammer home the point that America will never recapture the apogee attained after the post-World War II boom and ensuing collapse of the Soviet Union. It may last a lot longer than anybody expects (I’ve personally posited Trump as the second-to-last US president of a unified USA, but I am usually always wrong on time frames, always).
The big questions then are:
- What will be the catalyzing event to end the current monetary regime and what will replace it?
- What would a post-nation-state America look like? Snow Crash? Daemon? Black Mirror?
- What is the time frame? Are we looking at 10 years? 50? Or should we be measuring this in generational increments?
- Does factoring in an eventual end to US hegemony change your business or your life calculus?
Less importantly but will get more press coverage:
- If (the remaining) US presidents continue on the theme of escalating shock value, who can possibly top Trump?
The third aspect to this, which I didn’t cover here, is the Thucydides Trap: if the US Empire is truly in unrecoverable decline, who ascends and does the friction between the challenger and the incumbent result in a war or no war? Graham Allison’s “Destined For War” looks at this question, he found that out of 18 previous situations throughout history when an Empire declined, 12 of them resulted in a war with the rising challenger.


A different take, same them, what I wrote in May 2017. “What Comes Next with the Decline of an Empire”. Minds matter, and minds move. Much of what I predicted is now coming about. https://jimcarroll.com/2017/05/trends-what-comes-next-with-the-decline-of-an-empire/
In a way, the polarisation chart is a secondary symptom consequential on the deficit chart. People know there is something wrong and look for a simple foe to vanquish to make it right. All politics is like this. People generally vote against what they don’t like rather than for what they want.
This is the reason negative campaigning works and will never be banished.
It is also means that politicians cannot legitimately claim mandates for their platforms. Even if you count all the votes they receive as positive endorsements (highly dubious due to “least evil” voting tactics noted above), usually more people voted against them than for – they merely commanded the largest minority.
I would say that the polarisation trend is reminiscent of the post WW-i Weimar Republic (not a good omen!). People often blame the vindictive Versailles treaty as dooming the Weimar Republic. However, I think its very structure was what doomed it.
Weimar inherited the pre-war German welfare state (an invention of Bismarck) designed to bind all levels of society to the state. All aspects of everyday life were brought into the realm of politics. The government tried to be a benevolent friend to everyone. But a politically derived favour to one group is usually a disfavour to many more. The omni-benovolent state is also an omni-annoying state. That makes it extremely fragile.
What is amazing, in retrospect, is that Weimar survived the great inflation of the early 1920s. Being able to point to the punitive Versailles treaty may actually have helped rally public support. By 1925 the new non-inflating currency was doing its job. But the structural fragility of over-politicization remained.
This makes more sense today (09/13/2025)
than it did when you originally wrote it…
(08/13/2018)…it feels now like if the decline of the USA doesn't happen in a rapid fashion, which it likely will not, that instead, the threat looming is looking more and more like WWIII breaking out, which likely will end much rather quickly indeed. People need to distance themselves from overexposure to the endless stream of bad news all politically motivated in presentation no matter where it is found. Break from technology as well, from time to time, when was the last time anyone went a whole week without their phone and looking at it 4 or more waking hours a day? I am like this and it isnt meant to live this life in this manner. No one i know hates their next door neighbors, regardless of their politics, expand that mode of thinking instead of quietly absorbing propaganda it is not healthy, from any direction, in any form. Live long and prosper!!!