

Bitcoin’s Current Market Structure In Light of it Strongest Annual Opening Ever
Kane McGukin of Argos Global Advisors takes a look at Bitcoin’s market structure in the face of a 40% rally off the end of the year lows.
The last time we asked Kane for his insights, the big question was whether we had just witnessed a capitulation event for the digital asset space (See: Is There a Trophy For Calling the Turn? )
Now we’re wondering if we’ve truly seen a bottom for Bitcoin and is it still behaving like a risk asset or has it finally taken its place as a sound money, safe haven sector amid an oncoming global recession?
This note was previously released to premium subscribers of The Crypto Capitalist (you can take advantage of our $2 trial here).
Kane’s Substack, The Mesh Point, is here.
Kane McGukin:
Here’s what I’m looking at:
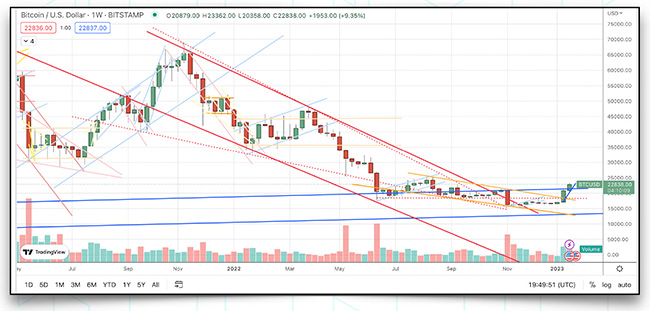
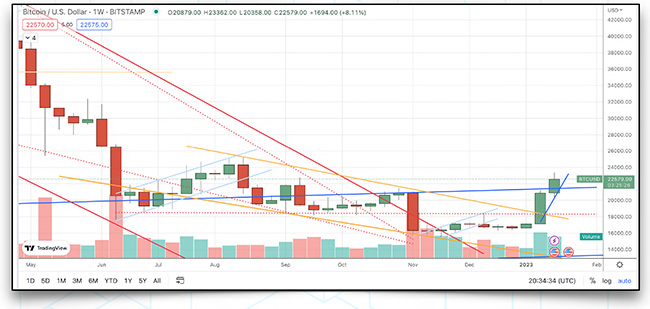
Yes, there are a lot of lines here! I keep them as a means to know where we possibly are, but also where we’ve come from. As time goes on, I lighten the colors that are no longer of relevant based on the changing course of price. Though at one point these were the primary bands for which market prices traded around. Let’s dig in…
What’s Important About Bitcoin’s Market Structure?
- Clear established downtrend that started in November 2021 – (dark red lines, down trending channel)
- Very large descending wedge within the downtrend (red dotted lines)(a) What’s important: Wedges tend to indicate trend changes / exhaustion of current price direction
(b) This matches with some on-chain indicators MVRV and Realized Price - Gold channel – the angle of descent has flattened while prices have traded in a tighter range. The breakout to the upside (above $18k) is an alert that warrants attention.
- The dark blue channel at the bottom goes back to the 2018 lows, and encompasses the general slope of pricing prior to that as well.
(a) What’s important: This slope indicates to me that prices are more in line with the long run slope which is sustainable. In a way, it’s the visual mean reversion from a period where prices were extremely over and above a sustainable rate of change.
How Do Other Asset Classes Look?
When you break it down, in simple terms, there are only 5 assets to choose from in terms of where you’re going to invest: Equities, Bonds, Commodities, Currency (DXY), Bitcoin
We still live in a dollar or not dollars world. We need them for consumption and global trade. Yes, Bitcoin is attempting to change that, but it’s still early. As we’ve seen since the fall of 2021 the dollar is still globally a very desirable form of money. Though cracks are obviously there.
As it stands, everything we do revolves around one question. Do I need dollars, or should I invest in something else?
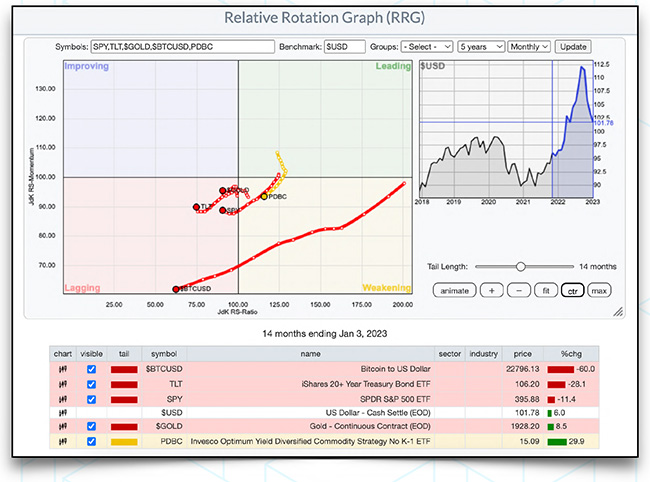
The answer is different for everyone. It’s dependent upon their immediate and future needs. So, timeframe is critical component to understand when it comes to investing. Over the last 14 months Gold, Commodities, and the Dollar are the only assets in positive territory.
As Wall Street has adopted Bitcoin, the behavior of the asset has changed a bit. Rather than acting as sound money asset it has acted more like a risk asset.
Only time will tell if this is temporary or permanent. Rather than debate it, I’m looking at various intermarket relationships. What can they tell us about the market and the trading behavior of market participants.
From March to August 2020, Bonds topped. Then risk assets and Bitcoin followed in November 2021. Not long after, equities followed suit in January 2022, then commodities in June of 2022. A typical and expected sequence of asset rotations.
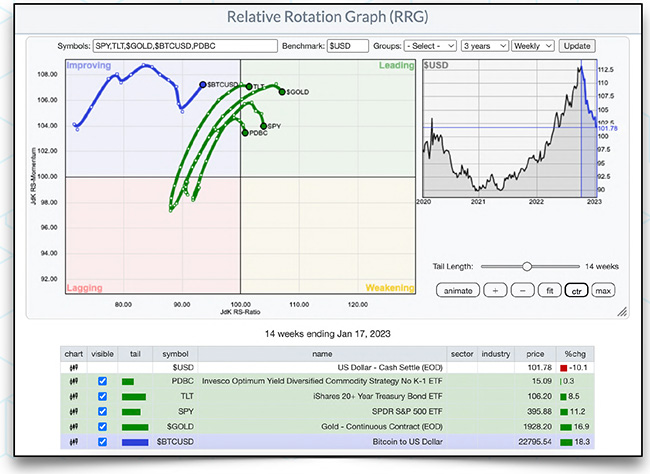
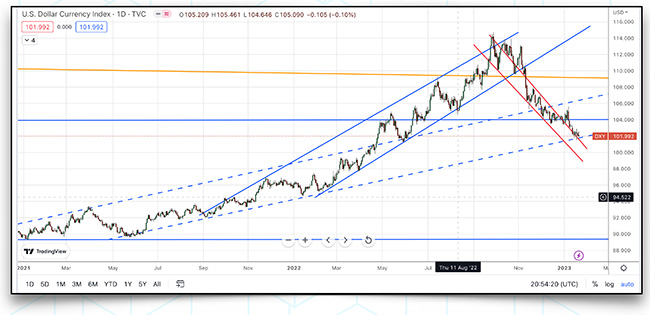
Taking a closer look, over the last 15 weeks, the dollar has sold off hard. Relieving most of the downward pressure on all other assets. Remember, like Mr. Miyagi said… Dollars on, Risk off. Dollars off, Risk on.
The dollar is down about 10%. Outside of commodities, all other assets are up 8% or more. Bitcoin in this period has sync’d back up with Gold (sound money) and delinked from tech. The QQQ, not shown, is only up 8.7% during this time.
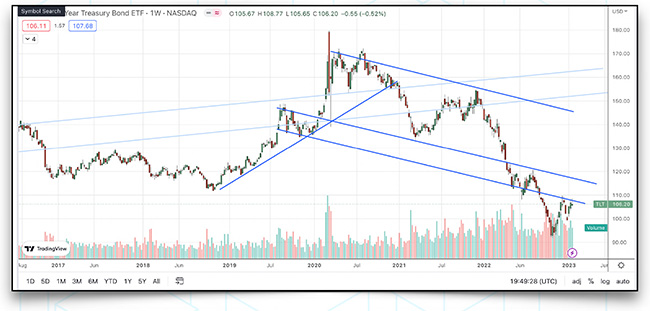
The traditional rotation at tops and bottoms starts with Bonds, then stocks, then commodities. With a new asset class embarking on the group (Bitcoin / digital assets) it’s important to monitor how they ultimately fit into this picture.
Bonds look to be working on a bottom but are lagging that of equities and bitcoin. The latter are coming out of channels or bumping up against resistance while bonds are still outside of their longer term channel. Given bonds are lagging, this rotation is slightly atypical.
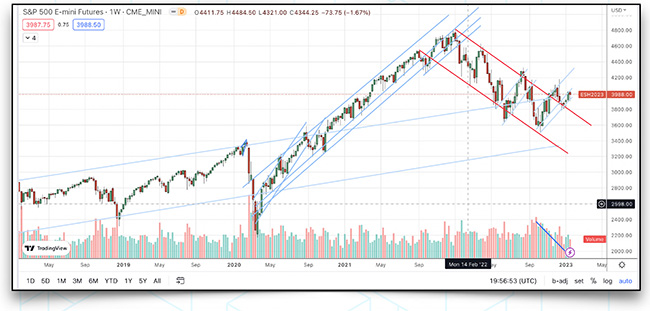
Stocks (below) appear to be working on a bottom and for the most part have positively structured charts across the board. On the bull side of things, maybe the bottom is in? However, there is significant resistance at 4200 and there is the fact that bonds didn’t bottom first… unless bonds go on a tear.
With all fundamental data points in recession territory (ISM, PMI, sentiment, NYFRB recession probability, ECRI), it feels as if we are in our first ever “not recession”, recession.
If that’s the case then the other shoe to drop would be weak earnings, analyst revisions to the downside for EPS’ and weak guidance. If, that happens, then I assume stocks would roll back down into the downtrend (red) and work towards the lower side of the blue channel. The one caveat here is that consumer sentiment is typically a contrarian indicator and it’s been nasty. The risk here is staying to pessimistic for too long.
The lower blue channel goes all the way back to the 2009 bottom. It’s a significant trend and sustainable rate of change for market prices. Prices aren’t quite as expensive as they were. Relative to this channel, the 4,808 high indicates how exuberance there was.
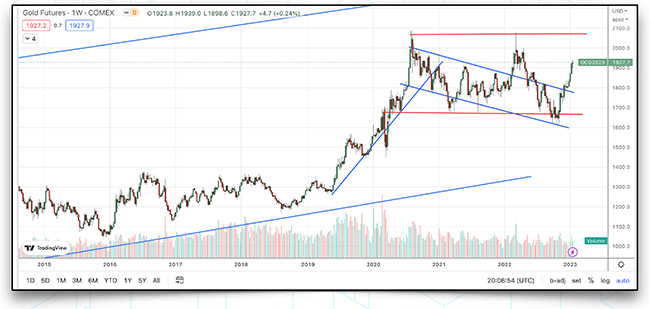
Gold visually has been exactly the inverse of the dollar recently. With geopolitical tensions abound this makes sense. Gold typically makes moves before events become known. Gold has been range bound between 1,700 and 2,100 since 2020. We know tensions exist because of the headlines we read but we also know it based on price.
Most physical dealers have quoted gold pretty consistently at $200 over spot when gold was weak. In my opinion that means there’s a steady bid and it’s been there for years now
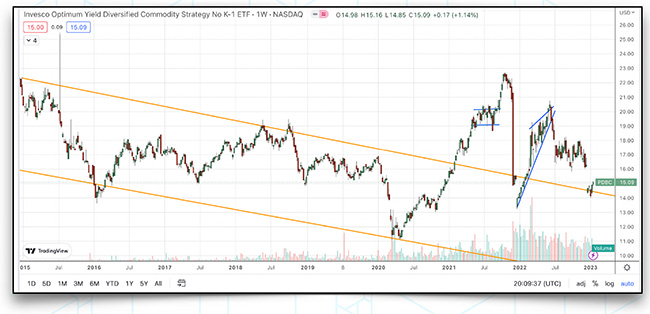
Looking at broader commodities they seem to be trading in line with what one would expect; being the last to bottom. Their structure, in that regard, makes sense.
The initial rally from the lower side of a long downtrend was the sign that inflation would in fact be a challenge. The breakout was the guarantee. Though notice commodities peaked in front of CPI falling. I’ve used PDBC because it’s tradable. Note that the big fall was from a distribution of 2 separate dividends that were paid in cash.
If Bitcoin Led Us Down, Will It Lead Us Up?
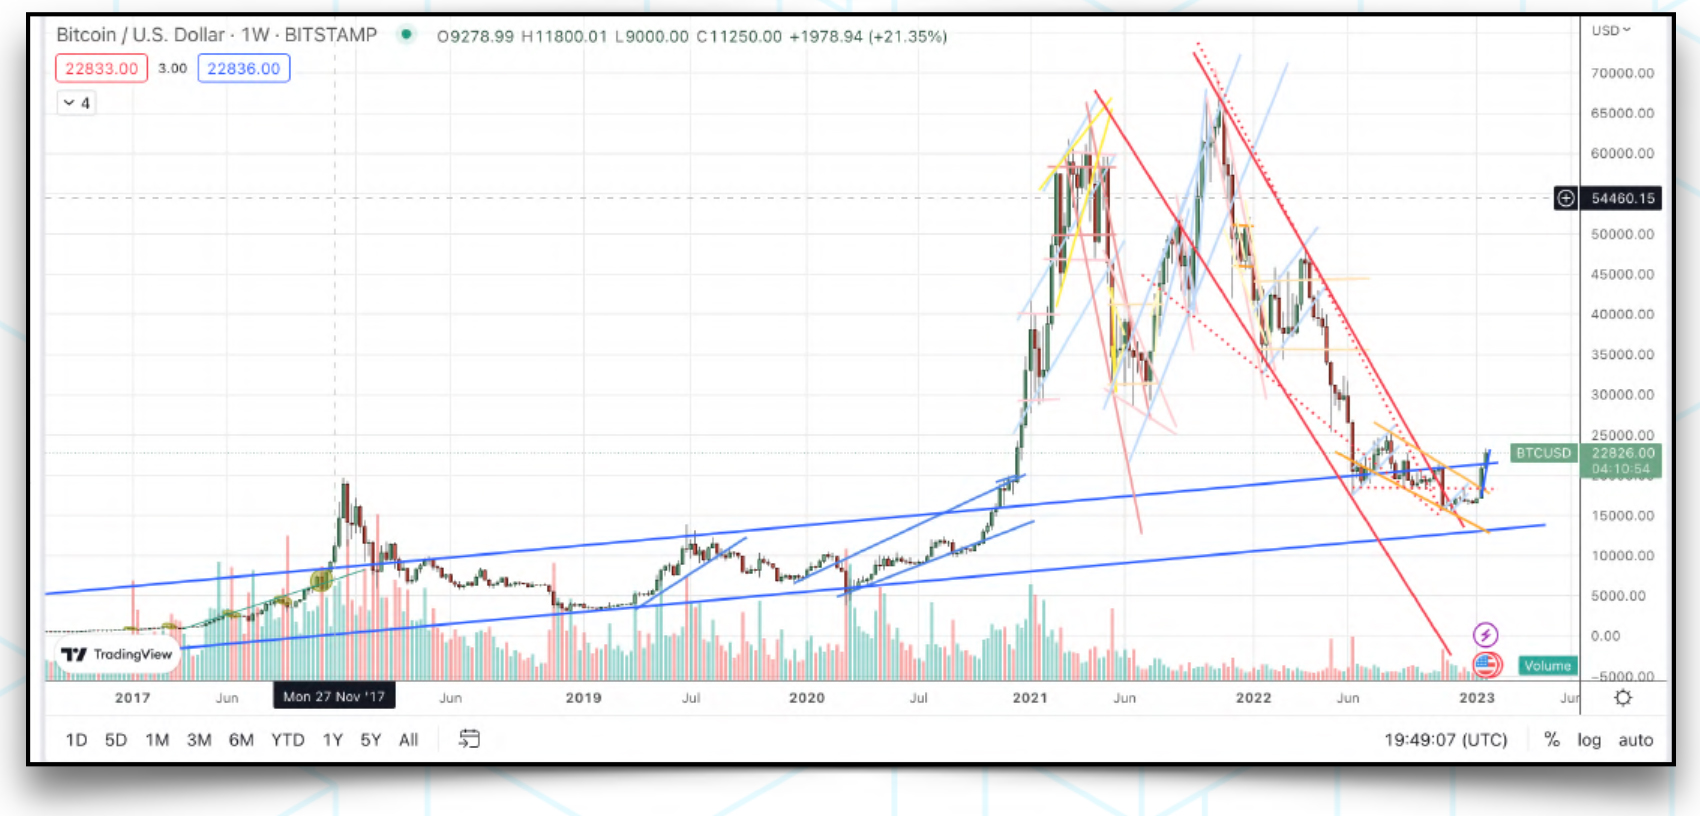
Up close, here’s what I’m watching for in Bitcoin and its relationship to the dollar. Imentioned above the downtrend and wedge. We’ve had a change in the grade of descent at the same time that we’ve broken back above some key resistance, now support – around the $18,200 level (horizontal red dotted line).
In breaking this, we saw price also break out of a shorter term down channel (gold). Additionally, BTC had traded back down into the long term channel (blue) but with this recent move up its now peaking above that.
We’re not out of the woods yet. We need to find out if the old channel acts as resistance or ignites a move. So far, it’s been a steep run in a short period, so I’d expect price to selloff a little as the momentum needs to digest things.
If price holds between $18k and $21k on a pullback the structure begins to look most like a bottom.
As I’ve laid out above, in this environment, a lot depends on the dollar. It’s been that way
since early 2021.
Looking at the dollar we can make some assumptions. We’re at the upper end of a long term downtrend. If that continues to hold then we’ll probably continue to see the dollar weaken though it won’t be a straight line and there will be many ups and downs in between as works to the bottom side of the channel.
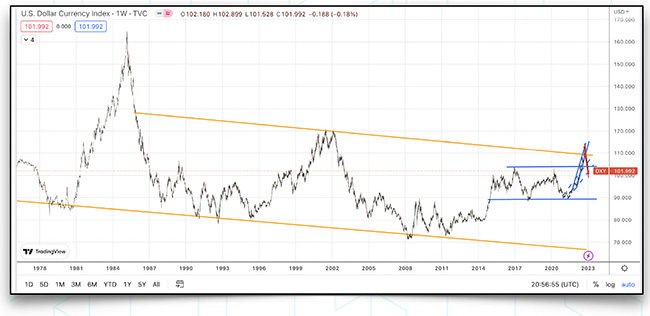
On the other hand, if the Dollar Milkshake Theory holds true then we may soon see the dollar rally and continue its break of this long term downtrend. Recent highs peaked above the trend but they quickly fell back below as systemic fault lines began to fracture.
For all assets, the dollar resuming its uptrend, would likely by the worst case scenario. This would likely continue the flight to safety. Bids would continue for treasuries, gold and cash. Bitcoin would be the misnomer here. It should do well, but it has traded as a risk asset for the most part of the last 3 years. More importantly, this is the first real global bear market that Bitcoin has been a part of.
So, technically we know how it should act in these moments. It should be the moment Bitcoin shines. However, we have no data and only narratives to prove this. So, Bitcoin will be the biggest question mark in terms of these relationships. We know what should happen but we still need proof.
Comclusion
As things sit, bonds still need to prove they are bottoming. The dollar is at critical support while stocks are bumping up against resistance. All while Bitcoin is working on potentially confirming a bottom as commodities are also finding support.
There are a number of things to be excited about but a few things that feel like they need more time as well. Though not fun, patience may be our best friend.
This note was originally sent to The Crypto Capitalist subscribers, our premium service that covers the digital asset space, publicly traded crypto stocks, and the macro backdrop of Late State Globalism and peak fiat. Try it today for $2, and if you don’t like it we’ll even give you the $2 back.
You can subscribe to Kane’s Substack, The Mesh Point, here.